Water is essential to life. Yet running water is becoming unaffordable across the US, in cities large and small. Water bills weigh heavily on many Americans as utilities hike up prices to pay for environmental clean-ups, infrastructure upgrades and climate emergency defenses to deal with floods and droughts. Federal funding for America’s ageing water system has plummeted, and as a result a growing number of households are unable to afford to pay their bills; millions of homes are being disconnected or put into foreclosure every year.
As we’ve seen during the coronavirus pandemic, unaffordable water poses a threat to individual and public health, housing and families. It also poses a threat to water quality: if people can’t afford to pay their bills, utility companies can’t raise the money needed for clean-ups.
What we did
We commissioned Roger Colton, an economist and lawyer who specialises in the affordability of utilities, to analyse the water burden in 12 diverse cities, and his full findings were published in an 88-page report. The metric used to measure affordability is bill burden: water and wastewater bills that cost more than 4% of annual household income were considered unaffordable in our analysis.
Quick GuideHow we did our water poverty investigation
Show
How bill burden measures affordability
The 12 cities analysed were chosen for diversity in size, population, poverty levels, geography and the factors driving the rise in water bills. The metric used to measure affordability is bill burden: water and wastewater bills that cost more than 4% of the annual household income are considered under this analysis a burden or unaffordable. (Energy bills of more than 6% of income are considered unaffordable.) It’s a tiered analysis taking into account that the lower the income, the bigger the burden: so 3% for those living under 50% of the federal poverty line (FDL); 3.5% for 50 to 100% FDL; 4% for 100-150% FDL; 4.5% for 150 to 200% FPL.
“The affordability question is not a question of how high the bill is, but rather how great of a burden does the bill impose on a customer as a percentage of income,” said analyst Roger Colton, a lawyer and economist with 40 years experience working on the affordability of utilities.
What is the poverty line?
The federal poverty line (FPL) is an income threshold based on household size which has been used by the government as a working or quasi official definition of poverty since the late 1960s. The same formula is still used by the Department of Health and Human Services (HHS) to determine eligibility for programs and benefits. Adjusted only for inflation, it is considered outdated as it doesn’t take into account housing, transportation, child care or medical costs, just groceries; nor does it consider geographical differences in living costs. The annual 2020 FPL for mainland US is $12,760 for a single person, adding $4,480 for every additional family member. 200% of the FPL is widely considered a more reasonable proxy for poverty. – Nina Lakhani
We considered the breadth of the problem: what percentage of residents in each income group live in neighbourhoods where the average water bill is unaffordable. And we examined depth: how unaffordable were these bills? In other words, what proportion of household income does the water bill represent? The analysis included every year from 2010 to 2018, and forecasts for 2030.
Overall, bills are rising nationwide, resulting in a growing number of households facing unaffordable expenses. Inevitably this is hitting low-income residents hardest. Water bills are almost universally unaffordable for the poorest – and have been for several years.
But each city is also different.
Key: Low-income = living below 200% of the federal poverty line (FPL); Very low-income = living below 50% of the FPL
Sources: Guardian investigation; Roger Colton; Circle of Blue; Ohio environmental protection agency; US census data; American Water Works Association.
Austin, TX
Population in 2018: 943,092
% of residents who live below 200% of the FPL: 31%
Bill increase between 2010 and 2018: 154% to $1,435
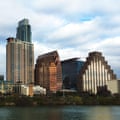
The breadth and depth of the water crisis looks likely to expand significantly in Austin by 2030: 84% of low-income residents could live in neighbourhoods with unaffordable bills, and for almost one in four the cost of water could exceed 12% of income. In real dollar terms, this means a person with an annual income of $20,000 would be faced with $2,400 for water and sewer costs.
Charlotte, NC
Population in 2018: 868,000
% of residents who live below 200% of the FPL: 33%
Bill increase between 2010 and 2018: 66% to $712
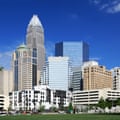
Charlotte stands out as the most affordable city, with unaffordable bills only impacting the poorest of the poor, and even then, never exceeding 7% of income. Nevertheless, the number of people in areas with unaffordable bills could double by 2030 to 44% – the equivalent of more than one in seven of the total population. Still, no neighbourhoods should face bills exceeding 12% of household income. For those living above the FPL, water should remain affordable (under 4% of income) going forward, unless rates rise more rapidly than in recent years.
Cleveland, OH
Population in 2018: 373,568
% of residents who live below 200% of the FPL: 60%
Bill increase between 2010 and 2018: 102% to $1642
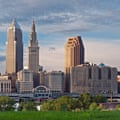
The water burden in Cleveland is broad, deep and getting worse. Cleveland has a very high rate of poverty, which means almost half the city (45%) currently faces unaffordable bills - by far the biggest proportion among the cities analysed. By 2030, water could be unaffordable for more than nine out of 10 low income residents, with virtually all those living below the FPL facing bills exceeding 12% of income.
Fresno, CA
Population in 2018: 521,710
% of residents who live below 200% of the FPL: 50%
Bill increase between 2010 and 2018: 82% to $432
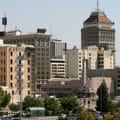
Fresno is projected to escape any significant increase in water poverty by 2030. It emerged as one of the most affordable cities analysed, with three quarters of low income people living in neighbourhoods with bills averaging under 3% of household income. But water is a burden for the poorest poor, with three out of every five living in neighbourhoods with bills averaging between 4% and 7% of income.
Indianapolis, IN
Population in 2018: 844,067
% of residents who live below 200% of the FPL: 42%
Bill increase between 2010 and 2018: 63% to $810

Indianapolis ranks mid-table when it comes to water affordability, with average bills costing no more than 9% of household income, even among the poorest poor. But by 2030, the percentage of low income residents with an unaffordable water burden could climb by 50%, and one in five will be landed with average bills exceeding 12% of household income. Here, at least, this heavy burden will still be limited to the poorest poor.
New Orleans, LA
Population in 2018: 374,022
% of residents who live below 200% of the FPL: 45%
Bill increase between 2010 and 2018: 96% to $1268
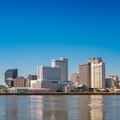
New Orleans arguably has the most serious affordability problem amongst the 12 cities studied – now and looking forward. Almost eight out every 10 low-income residents live in an area with unaffordable bills, but it’s not just that: almost 30% already face bills which exceed 12% of average household income. The situation looks untenable by 2030, with 83 of low income people facing bills exceeding 9% of household income. We’ll be reporting from New Orleans over the coming months.
Philadelphia, PA
Population in 2018: 1,538,479
% of residents who live below 200% of the FPL: 47%
Bill increase between 2010 and 2018: 54% to $906

Philadelphia ranks third with regards to the proportion of residents living in neighbourhoods with unaffordable bills, due to the city’s overall high rates of poverty. Notably, the depth of the water burden is currently less drastic than in other big cities, with average bills not exceeding 9% of income. However, by 2030, almost a quarter the Philadelphia’s low-income population could face bills exceeding 12% of income.
San Diego, CA
Population in 2018: 1,393,271
% of residents who live below 200% of the FPL: 31%
Bill increase between 2010 and 2018: 60% to $1416
San Diego joins Cleveland, New Orleans and Santa Fe as having the most severe water affordability problems, both in terms of breadth and depth. In 2018, almost two-thirds of low-income residents lived in neighbourhoods with unaffordable water bills, which exceeded 12% of income for one in every seven of this cohort. If nothing changes, the future looks bleak for San Diego, with almost 83% of its low-income population poised to live in neighbourhoods with unaffordable water bills by 2030. Almost half could face bills exceeding 7% of income.
San Jose, CA
Population in 2018: 1,020,565
% of residents who live below 200% of the FPL: 24%
Bill increase between 2010 and 2018: 93% to $1,008
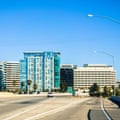
San Jose’s low poverty rate meant that only one in 10 of the city’s total population faced unaffordable water bills in 2018. However, water is already a significant burden for just over 40% of the city’s poor, and the problem is forecast to affect two thirds of this population by 2030. And for more than half of those struggling to make ends meet in 2030, water bills will exceed 7% of household income.
Santa Fe, NM
Population in 2018: 83,560
% of residents who live below 200% of the FPL: 34%
Bill increase between 2010 and 2018: 27% to $1,845

Santa Fe has a widespread water affordability problem affecting 70% of low-income residents in 2018 - the equivalent of a quarter of the drought-prone city’s total population. Already the water burden runs deep for low income people, with more than a third living in neighbourhoods where average bills exceed 7% of income. By 2030, the situation could be dire, with almost 100% of low-income residents, representing a third of the city’s total population, living in neighbourhoods with unaffordable water burdens. By then, one-third of low income residents could face bills exceeding 12% of income.
Seattle, WA
Population in 2018: 725,101
% of residents who live below 200% of the FPL: 23%
Bill increase between 2010 and 2018: 44% to $1,254

Unaffordable water bills are currently only a problem for the city’s poorest residents. In fact, one in three low income residents live in neighbourhoods where average bills are 3% or less of household income. But the city faces challenges and by 2030, the proportion of low income residents facing unaffordable bills could rise by 50%. And half of these people will be in neighbourhoods where average bills exceed 7% of household income.
Tucson, AZ
Population in 2018: 521,731
% of residents who live below 200% of the FPL: 48%
Bill increase between 2010 and 2018: 119% to $869
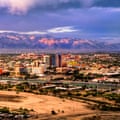
Tucson does not currently experience the deep levels of water poverty widely seen among the other cities studied – even within the lowest income bracket. But by 2030, the burden will significantly expand, with half the city’s low income population, representing 25% of all residents, living in areas with unaffordable bills. Still, none should face super-high bills exceeding 12% of income, while almost a third are projected to live in neighbourhoods with bills averaging less than 3% of income.